

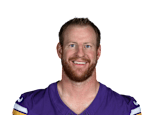


Carson Wentz
- Pass yd/gPass yds/g
- 119.0
- Comp-AttComp-Att
- 31-6448%
- Y/AYards / attempt
- 5.6
- TD / INTTD / INT
- 3 / 2
- EPA/dbEPA / dropback
- −0.19#43 of 51 QBs
Before the lines post · next: at SF
No lines posted yet
Pass ydsNo line yet
MINat
 SFSun, Nov 22, 8:20 PM ET
- Spread
- SF -3.5
- Total
- 46.5
- Wind
- 6 mph
- Rest
- 7 days
This gameInjuries and game notesShowHide
Injury report
- His status
- Not on the report
MIN 2 out · SF 2 out · show who· hide
- Out for MIN
- Jordan Addison WR, Kyler Murray QB
- Out for SF
- C.J. West DT, Nate Hobbs CB
MIN's starting QB is out: Kyler MurrayOut · Hamstring
MIN without him (20 games, this season and last): passed on 60% of plays (61% with him), 176 passing yards a game (210), 17.3 WR targets (14.8), 20.6 RB carries (21.2).
Across the NFL since 2015 (660 games without a team's main QB): pass rate 55% to 53%, passing yards −13%, WR targets −9%, WR yards −14%, RB carries +1%. History, not a forecast: the books usually move the lines once a starter is ruled out.
Carson Wentz's full breakdown holds the game-by-game chart, hit-rate splits and filters, the what-if line and market curve, every book and the line history, closing lines, the projected range, teammates and matchup tools. Checking your player views…
Checking your player views…- the game-by-game chart
- hit-rate splits and filters
- the what-if line and market curve
- every book and the line history
In Carson Wentz's full breakdown · 9 sections
- How he gets thereThe line taken apart into volume and rate, in the situations this game has
- Where his throws goBy zone, against how SF's defense covers each
- Throw qualityCatchable balls, drops and pressure, against the league
- Splits and matchupsHis hit rate by situation, similar players vs SF and players at his spot vs SF
- Team volumeDropbacks, carries and pass rate, against what SF's defense faces
- Who gets the ballHow his team's targets and carries are shared
- Role and teammatesSnap share game by game, and who goes over with him vs SF
- Line journey and every bookHow the line moved since it opened, each book's number and price
- Market curveThe books' chance at every number they price, against his record at each
Game log
| Game | Result | C/A | Pass yds | TD | INT | Snap % |
|---|---|---|---|---|---|---|
| 2026average of 3 gamesavg | 2-1 | 10/21 | 119.0 | 1.0 | 0.7 | 89% |
W9  vs BUFNov 9 | L 6–23 | 8/25 | 81 | 0 | 2 | 83% |
W2  @ CHISep 20 | W 9–3 | 11/20 | 143 | 0 | 0 | 100% |
W1  vs GBSep 13 | W 39–22 | 12/19 | 133 | 3 | 0 | 83% |
| 2025average of 5 gamesavg | 2-3 | 22/34 | 243.2 | 1.2 | 1.0 | 93% |
W8  @ LACOct 23 | L 10–37 | 15/27 | 144 | 1 | 1 | 88% |
W7  vs PHIOct 19 | L 22–28 | 26/42 | 313 | 0 | 2 | 100% |
W5  @ CLEOct 5 | W 21–17 | 25/34 | 236 | 1 | 0 | 98% |
W4  @ PITSep 28 | L 21–24 | 30/46 | 350 | 2 | 2 | 100% |
W3  vs CINSep 21 | W 48–10 | 14/20 | 173 | 2 | 0 | 80% |
By quarter and halfHis production in each part of the game
78% of his pass TDs come in the second half, 68% of his rush yds in the second and 65% of his rush att in the first. The rest split about evenly.
2025 and 2026 seasons · per game, 8 games
| Stat | Game | Q1 | Q2 | Q3 | Q4 | 1st half | 2nd half | 1st halfSplit |
|---|---|---|---|---|---|---|---|---|
| Pass yds197 a game | 197 | 40.1 | 62.0 | 32.5 | 62.0 | 102 | 94.5 | 52%first half |
| Pass att29.1 a game | 29.1 | 5.6 | 9.5 | 5.4 | 8.6 | 15.1 | 14.0 | 52%first half |
| Pass TDs1.13 a game | 1.13 | 0.13 | 0.13 | 0.38 | 0.50 | 0.25 | 0.88 | 22%first half |
| Rush yds7.75 a game | 7.75 | 0.75 | 1.75 | 2.00 | 3.25 | 2.50 | 5.25 | 32%first half |
| Rush att2.50 a game | 2.50 | 0.75 | 0.88 | 0.38 | 0.50 | 1.63 | 0.88 | 65%first half |
Overtime counts in the second half. The score shapes these too: a team ahead runs more late. History, not a forecast.
Prop lines come from DraftKings, FanDuel, BetMGM, Caesars, theScore Bet and Hard Rock and can lag what a book shows right now; check the book before you rely on a number. Splits count the games he played (snap counts show who was on the field) and describe the past; they are not a prediction. A game he played with no stat line counts as a zero; a game he sat out is left out, because books void the prop then. Data and analytics only, not betting advice: any bet is your own decision, and we are not responsible for losses. 21+ only. Gambling problem? Call or text 1-800-GAMBLER.