

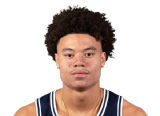


Courtney Wallace
- PTS
- 11.4
- REB
- 4.0
- AST
- 3.2
- 3PM
- 1.4
- MIN
- 27.6
- FG%
- 41.4%
No lines posted yet

Courtney WallacePointsNo line yet
YALEat
 BELMon, Nov 23, 4:00 PM ET
This gameInjuries and game notesShowHide
Courtney Wallace's full breakdown holds the game-by-game chart, hit-rate splits and filters, the what-if line and market curve, every book and the line history, closing lines, the projected range, teammates and matchup tools. Checking your player views…
Checking your player views…- the game-by-game chart
- hit-rate splits and filters
- the what-if line and market curve
- every book and the line history
In Courtney Wallace's full breakdown · 6 sections
- How he gets thereThe line taken apart into volume and rate, in the situations this game has
- Splits and matchupsHis hit rate by situation, similar players vs BEL and players at his spot vs BEL
- Minutes game by gameHis minutes each game and where his role changed
- When he goes over, who else didTeammates' props in the games he cleared his line
- Similar players vs BELPlayers with his profile against this opponent, each against their own line
- Line journey and every bookHow the line moved since it opened, each book's number and price
Game log
| Game | Result | Min | Pts | Reb | Ast | 3PM | FG | +/- |
|---|---|---|---|---|---|---|---|---|
| 2026–27average of 5 gamesavg | 2-3 | 27.6 | 11.4 | 4.0 | 3.2 | 1.4 | 41% | |
Nov 18  vs UVM | W 76-74 | 38 | 11 | 4 | 5 | 1 | 5-14 | — |
Nov 13  @ NEbench | L 73-84 | 25 | 17 | 1 | 2 | 3 | 7-12 | — |
Nov 10  @ BAYbench | L 61-90 | 26 | 13 | 1 | 3 | 1 | 5-8 | — |
Nov 6  @ UCFbench | L 75-87 | 29 | 14 | 3 | 2 | 2 | 6-13 | — |
Nov 2  vs HOWbench | W 72-62 | 20 | 2 | 11 | 4 | 0 | 1-11 | — |
| 2025–26average of 9 gamesavg | 8-1 | 4.0 | 1.2 | 0.6 | 0.6 | 0.1 | 56% | |
Feb 21  vs PENNlimited minutes | W 74-70 | 1 | 0 | 0 | 0 | 0 | 0-1 | — |
Feb 13  @ DARTlimited minutes | W 83-70 | 2 | 0 | 1 | 0 | 0 | 0-1 | — |
Jan 19  vs COLUlimited minutes | W 91-74 | 2 | 2 | 0 | 1 | 0 | 1-1 | — |
Jan 17  vs CORlimited minutes | W 102-68 | 5 | 2 | 1 | 0 | 0 | 1-1 | — |
Dec 29  @ ALAlimited minutes | L 78-102 | 1 | 0 | 0 | 1 | 0 | 0-0 | — |
Showing 10 of 14 games. The full game log is part of the player's full breakdown, which Pro opens with no limit.
Averages and splitsPer game by window, then home, rest, result and role
Per game · 2026–27 regular season History
| Stat | Season5 g | Last 105 g | Last 55 g | Home2 g | Road3 g | 2025–269 g | Last 10 games |
|---|---|---|---|---|---|---|---|
| Minutes | 27.6 | 27.6 | 27.6 | 29.0 | 26.7 | 4.0 | |
| Points | 11.4 | 11.4 | 11.4 | 6.5▼ | 14.7▲ | 1.2 | |
| Rebounds | 4.0 | 4.0 | 4.0 | 7.5▲ | 1.7▼ | 0.6 | |
| Assists | 3.2 | 3.2 | 3.2 | 4.5▲ | 2.3▼ | 0.6 | |
| Threes | 1.4 | 1.4 | 1.4 | 0.5▼ | 2.0▲ | 0.1 | |
| Pts + Reb + Ast | 18.6 | 18.6 | 18.6 | 18.5▼ | 18.7▲ | 2.3 | |
| Steals | 0.8 | 0.8 | 0.8 | 1.0▲ | 0.7▼ | 0.0 | |
| Blocks | 0.2 | 0.2 | 0.2 | 0.0▼ | 0.3▲ | 0.1 | |
| Turnovers | 1.6 | 1.6 | 1.6 | 1.5▼ | 1.7▲ | 0.2 |
▲ / ▼ show a window above or below his season average. Bars are his last ten games, newest on the right; green is at or above the season average (dashed line). Regular season only.
Venue
small sampleThe badge is home minus away.
Game result
small sampleThe badge is in wins minus in losses.
Role
small sampleThe badge is as a starter minus off the bench.
Per-game averages in each situation over the season shown (regular season and playoffs). Rest is days since the team's last game. Descriptive history, not a projection for the next game.
Last game
From box scores and play-by-play; a game they did not play is not in the log. Prop lines from DraftKings, FanDuel and BetMGM; hit rates are past games against a number, not a forecast or a pick. Data and analytics only, not betting advice: any bet is your own decision, and we are not responsible for losses. 21+ only. Gambling problem? Call or text 1-800-GAMBLER.